
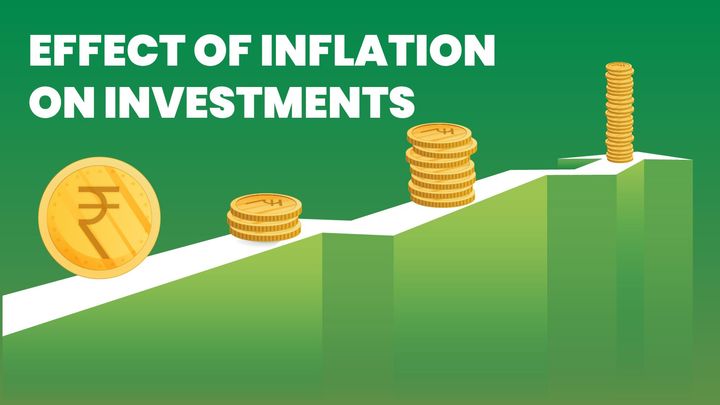
Nifty has fallen from 18887 levels to 17412 levels in the last 3-4 months amid Global recession fears, high inflation, and rapped interest rate hikes by US Fed, and also ongoing geopolitical tensions have contributed to the current fall. Many retail infesters who have entered the market post-Covid are moving out of the market as they have burned their fingers. Even seasoned investors are getting frustrated with their retunes and tired of averaging or accumulating their favorite stocks. With this more than year-long consolidation in the broader market, everyone asked me only one question "Has Nifty made its Bottom yet??"
So, Let's check whether we are at the bottom or if some more pain is left in the market through Charts. Blue Line in Below given Chart is a ratio chart of the S&P 500(US) VIX and India VIX on a weekly time frame. This chart indicates, it's near its resistance zone and it should fall from the current level. for that to happen either India VIX has to rise sharply or S&P 500 VIX should fall sharply.

Let's Check the individual charts of Both VIX. in the given chart Orange Line chart is of S&P 500 VIX Chart and the Sky-Blue Chart is of India VIX. As you can see US VIX has crossed its previous Resistance and is trading above that level. Now next level one can expect to see is around 31. but if S&P 500 VIX moves up then the ratio of both VIX will go beyond its resistance zone which is a very unlikely event as since 2010 this ratio has never gone above 1.88 on the weekly chart and currently it's trading at 1.85.
So, what about another scenario? which is India VIX should move up. as you can see on the India VIX weekly chart. it's trading near 2021 Lows. and recently traded near the 12 levels which is considered to be unusually Low. it went below the 12 mark several times in the last 5 years but it was not able to sustain below the 12 mark and bounce back to 18-20 levels. Considering the Recent fall from 18887 levels in Nifty India VIX should have gone up but it did not move up. Moreover, with Global recession fears amid high inflation and rate hikes, and with ongoing geopolitical tensions, India VIX seems very low. Considering all these factors, an up move in India VIX looks very likely.

But What does it mean for normal traders and investors?
VIX is the Volatility index and tells about how fearful traders are in the Market. A low VIX indicates no Fear in the market and a high VIX Indicates fear in the market. VIX increases with a fall in the market and decreases with a rise in the market. so if as per our analysis, the second scenario is very likely to play out i.e. India VIX should move up. This means the Indian market should fall sharply to push India VIX to higher levels. so, the Answer to the original question is no we are not at the bottom yet we may continue to see some more pain in the coming few weeks.

Comments ()